Science feeds on images. Like the sketches of flying machines by Leonardo da Vinci, they help scientists give substance to their ideas and report on their work. Science communication uses these images and produces new ones since they provide an excellent tool for scientists to connect with their audience. Among the various forms of science illustration, Agent Majeur reports on the use of schematics and drawings.
Which scientific illustration and for what use?
Images draw attention, awaken interest, and make things clear. They are objects on our scale that are able to represent the infinitely big and the infinitely small, and show us the past, present and future. Science communication mainly uses three types of images:
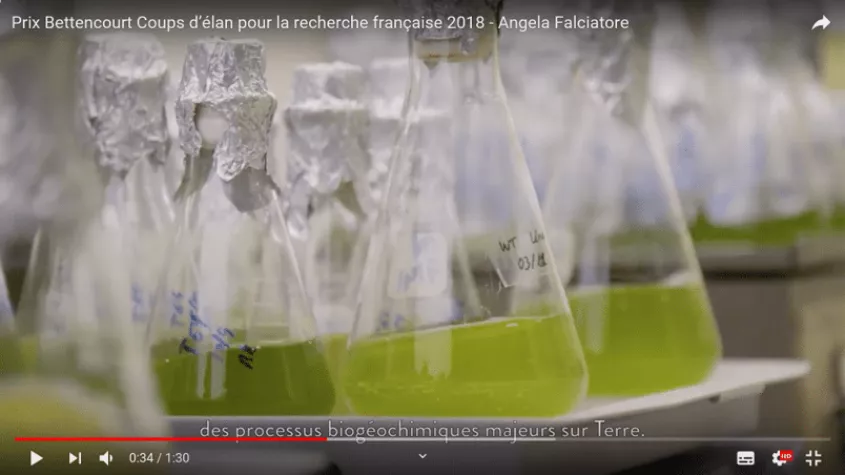
- Photos and videos, evidence of past or present reality;
- Tables and charts, representing quantities or values;
- Drawings and schematics, representing events or items.
In this article on science illustration, we will focus on drawings and schematics.
Scientific drawings, conventions and practices
A scientific drawing aims to faithfully reproduce the studied subject. It is characterized by its precision and its objectivity, because it must above all respect proportions, volumes and include all the detailed characteristics of the observed subject. It is accompanied by explanations such as a title, legend and scale.
Techniques for scientific drawings range from a simple pencil sketch to more elaborate illustrations done with watercolor or ink. However, regardless of the technique, they must be accurate. As such, these drawings require excellent technical skills and in-depth knowledge of the subject represented.
Used in fields as diverse as botany, zoology or anatomy, scientific drawings remain an invaluable tool to document, study and communicate scientific observations, even in this digital age.
Schematics, a tool to illustrate a device or process
Drawings focus on accurately reproducing the shape of an object. Often done with a pencil, they are used to represent fauna and flora. Schematics provide more freedom since they represent things that are inaccessible in space or time, even phenomena that do not yet exist. They show specific perspectives (e.g. a cross-section) and they offer the possibility to highlight or dim elements according to their importance.
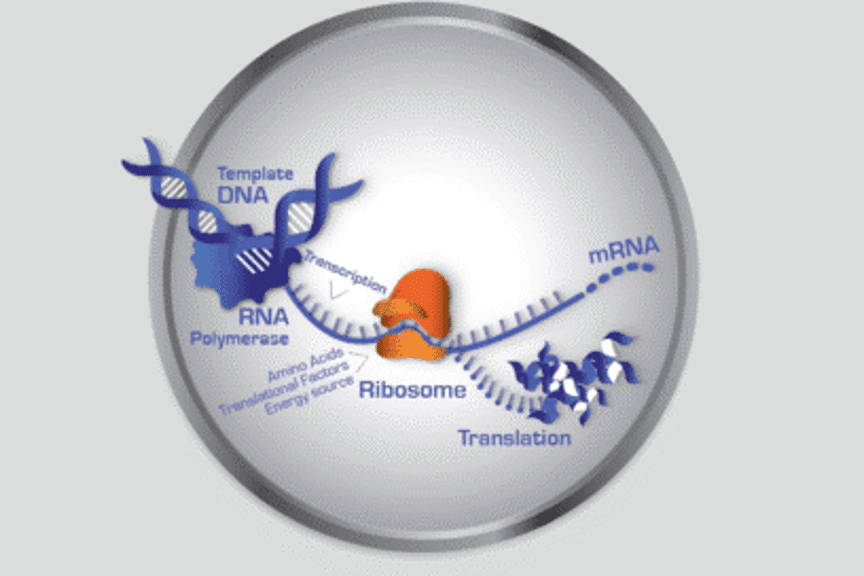
The illustration below is a schematic done for Synthelis, a biotechnology company specialized in protein production using a cell-free process. It consists in simulating the inside of a cell in a test tube in order to synthesize proteins from a DNA sequence. The schematic is a replica of an environment which is too small to be visible by the naked eye. In a stylized way, it makes it possible to understand it.
The aim of a scientific schematic can also be to popularise. The illustration below explains how an MRI exam works and the type of imaging obtained.

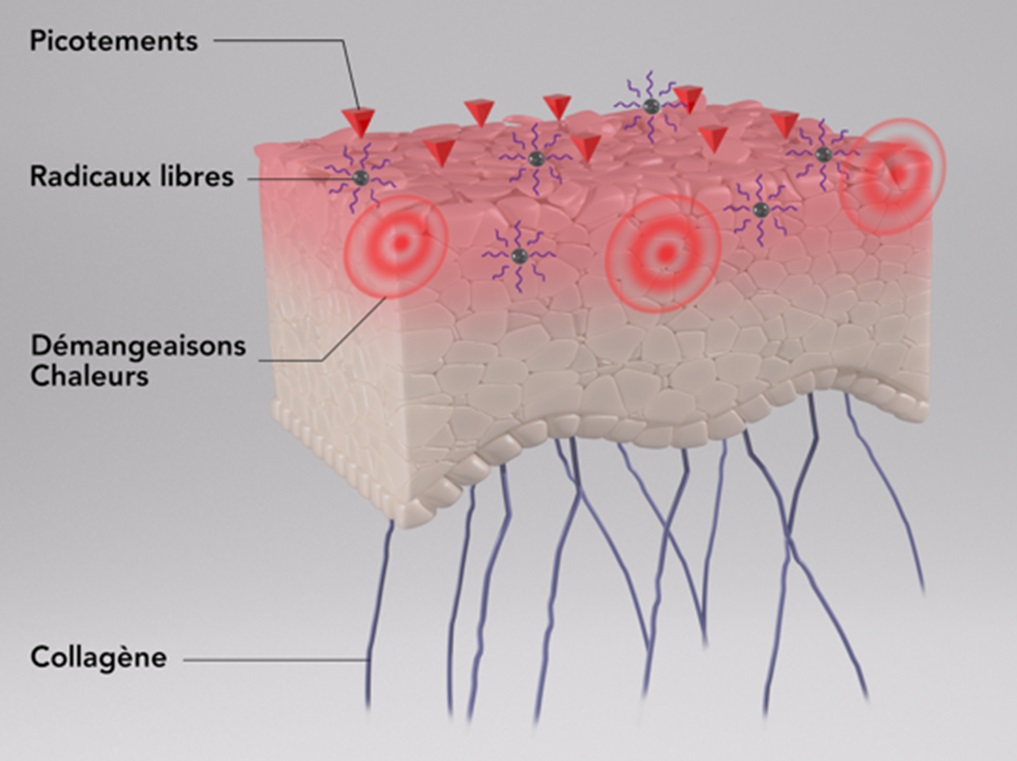
Finally, this other schematic is a 3D visualization of irritated skin. The drawing, associated with explanatory texts, makes it possible to quickly understand the biological consequences of skin irritation.
Sketchnoting: schematics and drawings to illustrate your speech
Combining schematics and drawings to illustrate your talk is a technique called sketchnoting. Taking visual notes is a very efficient way of explaining complex ideas. Live drawing during a scientific presentation creates complicity with your audience and makes it easier to understand your subject.
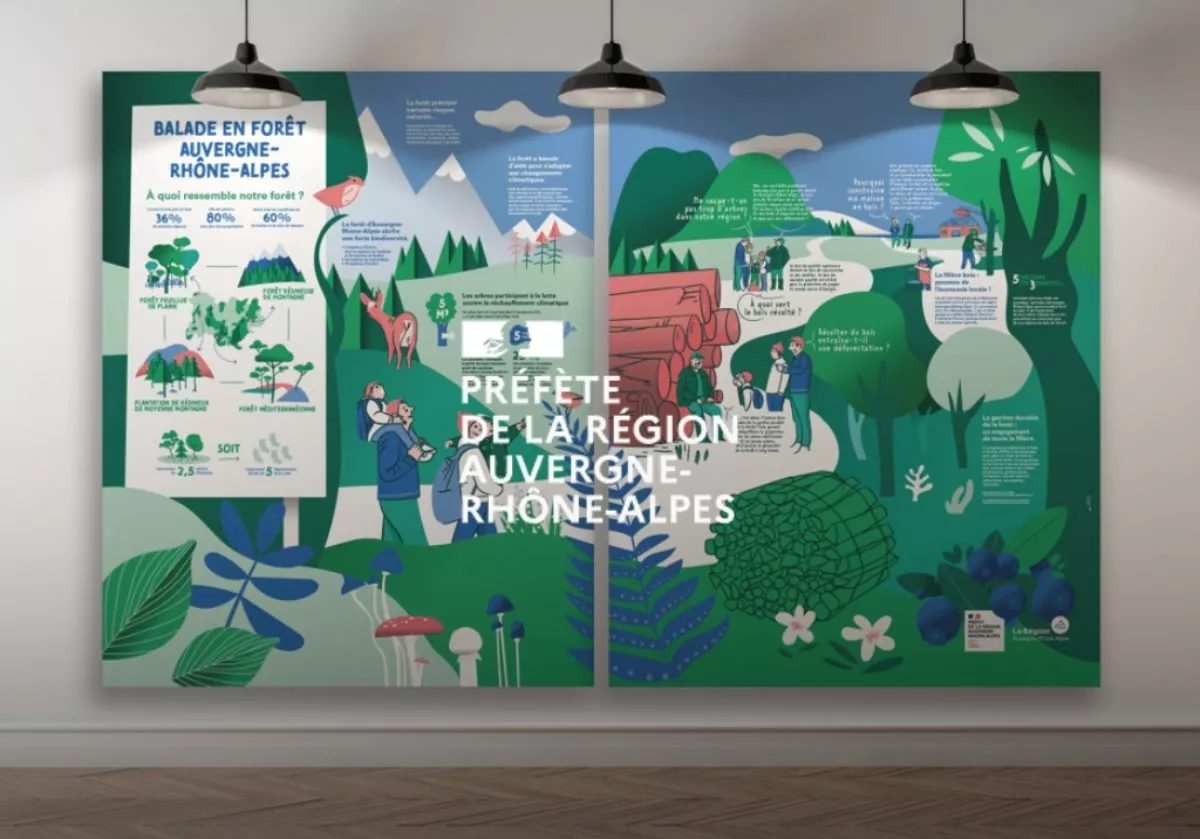
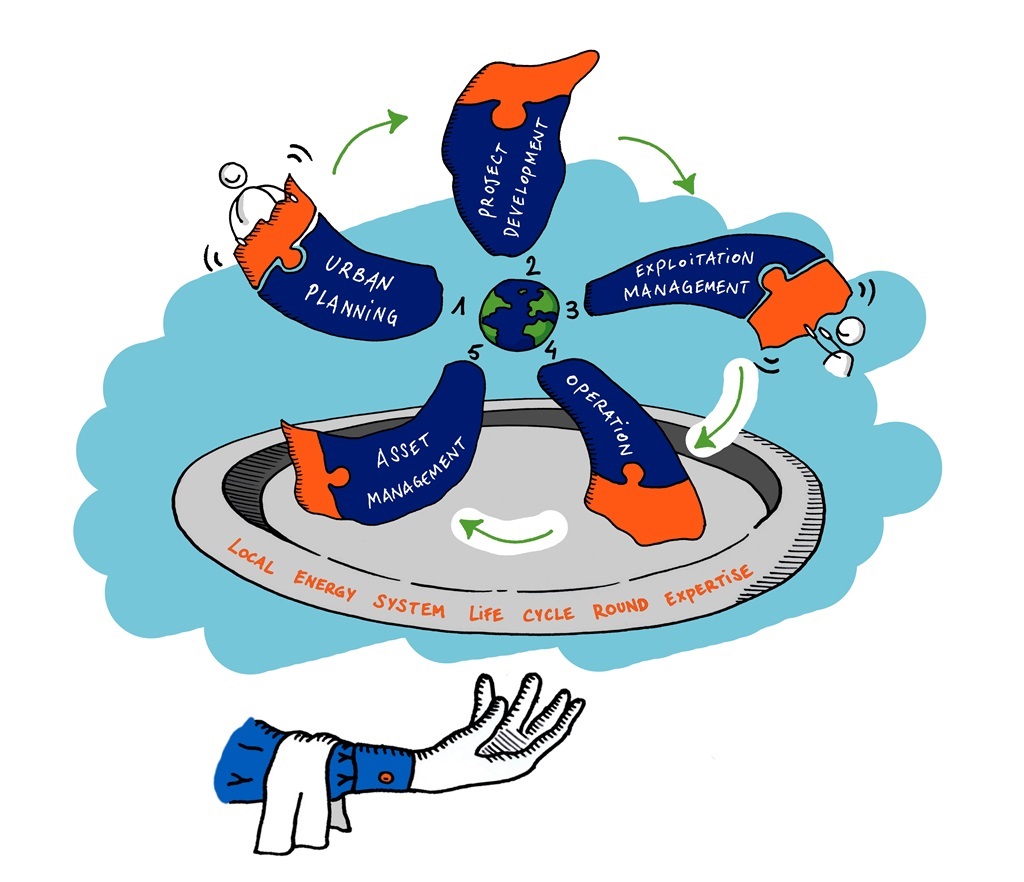
This type of visual can also be used to popularize a scientific message to the general public. For example, below you can see a sketchnote done for the French national electricity supplier (EDF). The objective of this illustration is to show the company’s expertise on local multi-energy systems, by playing around with the logo, which everyone knows. The drawing is simple, colored and easy to read. This presentation has the advantage of speaking to different audiences, an internal audience as well as decision-makers, who have less technical expertise.
Tools for creating scientific illustrations
Researchers and promoters of innovative projects can create their own scientific illustrations using specialized software. These tools make it easy to create scientific schematics by providing collections of vector images, diagrams and scientific symbols. Some software are specialized in scientific fields such as biology, chemistry, or physics. They offer graphic libraries adapted to the needs of each field.
Hiring the services of a scientific illustrator
Using the services of a scientific illustrator is an excellent alternative for those who want original, tailored and high-quality illustrations. A scientific illustrator masters both drawing and illustration techniques, and has background scientific knowledge to interpret and visually translate complex data or concepts.
An illustrator will be able to create illustrations adapted to different types of audiences, whether specialists or non-specialists. They will also be able to suggest the most relevant and nice-looking representations, thus guaranteeing a precise and attractive result.
Researchers can make their own science illustrations or call upon a science illustrator. This collaboration requires the definition of a design brief describing the visual to create with the help of text and possibly a sketch. For a moving image, we recommend you detail the various steps of the animation with a scenario.
As part of our services, Agent Majeur creates 2D & 3D science illustrations. Please contact us to discuss your needs.